Formation of local high concentrations with stripe- or spot-like geometries

Stripe-like activations: In an activator-inhibitor interaction, stripes-like activations are formed if the autocatalysis saturates at some maximal level of local activation. The restricted maximum peak height causes an enlargement of the activated regions until an equilibrium between the self-enhancing and the antagonistic reaction is achieved. However, for a stable activation, lateral inhibition requires the proximity of non-activated cells into which the antagonist can be dumped or from which a necessary co-factor can be obtained. These seemingly contradictory requirements, large activated regions and non-activated cells in the direct neighbourhood, are satisfied in stripe-like patterns. Then, each activated cell has activated neighbours along the stripe and non-activated neighbours perpendicular to it.
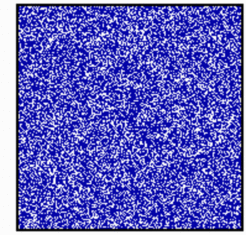
Simulation performed with an activator (a) -inhibitor (b) system. Density of dots indicates the activator concentration. The following equation has been used:

a and b denote the activator and inhibitor concentrations. The equations describe the concentration changes of the activator and the inhibitor per time unit. Addition of the concentration changes to given initial concentrations lead to new concentrations at a subsequent time point. Many such iterations lead to the concentration profile as function of space and time as plotted. The three terms on the right of the equation describe the autoregulatory production rate, the normal decay and the diffusion.
Calculated with: Da = 0.002 ;ra = 0.01; ba = 0; sa = 0.3 is the critical parameter that leas to to saturation of the self-enhancement at high activator concentrationsand thus to stripe formation;Â s = ra + 1% fluctuation; Db = 0.2; rb = 0.015. 200 Iterations between each frame, 70 frames in total; 30 * 30 cells.
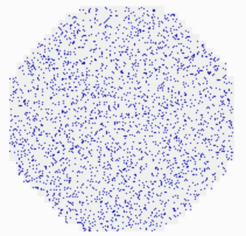
For comparison, without saturation a spot-like activation is formed:

For the simulation above the following parameter have been used:Â Da = 0.001 (activator diffusion rate); ra = 0.0001 (activator decay or removal rate); ba = 0 (baseline, i.e., activator-independent production rate); sa = 0; (i.e., no saturation at high activator concentrations); autoregulatory production rate: s = ra + 1% fluctuation. The random fluctuations are sufficient to trigger the pattern;Â Db = 0.2; rb = 0.0003. The final pattern is stable since the activator has a longer time constant than the inhibitor, i.e., ra <Â rb. Pattern formation is possible since the range of the inhibitor is much larger than that of the activator, Da >> Db; Â 2500 Iterations are calculated between each frame, 70 frames in total; 32 * 32 cells.


